Scoring Visualizer Plugin
Last updated: October 12, 2026
The Scoring Visualizer plugin charts a patient's scored questionnaire results over time. Instead of opening each past result, you can see how scores such as the PHQ-2, PHQ-9, GAD-2, or GAD-7 have changed across visits in one view.
Open the visualizer
Open the patient's chart.
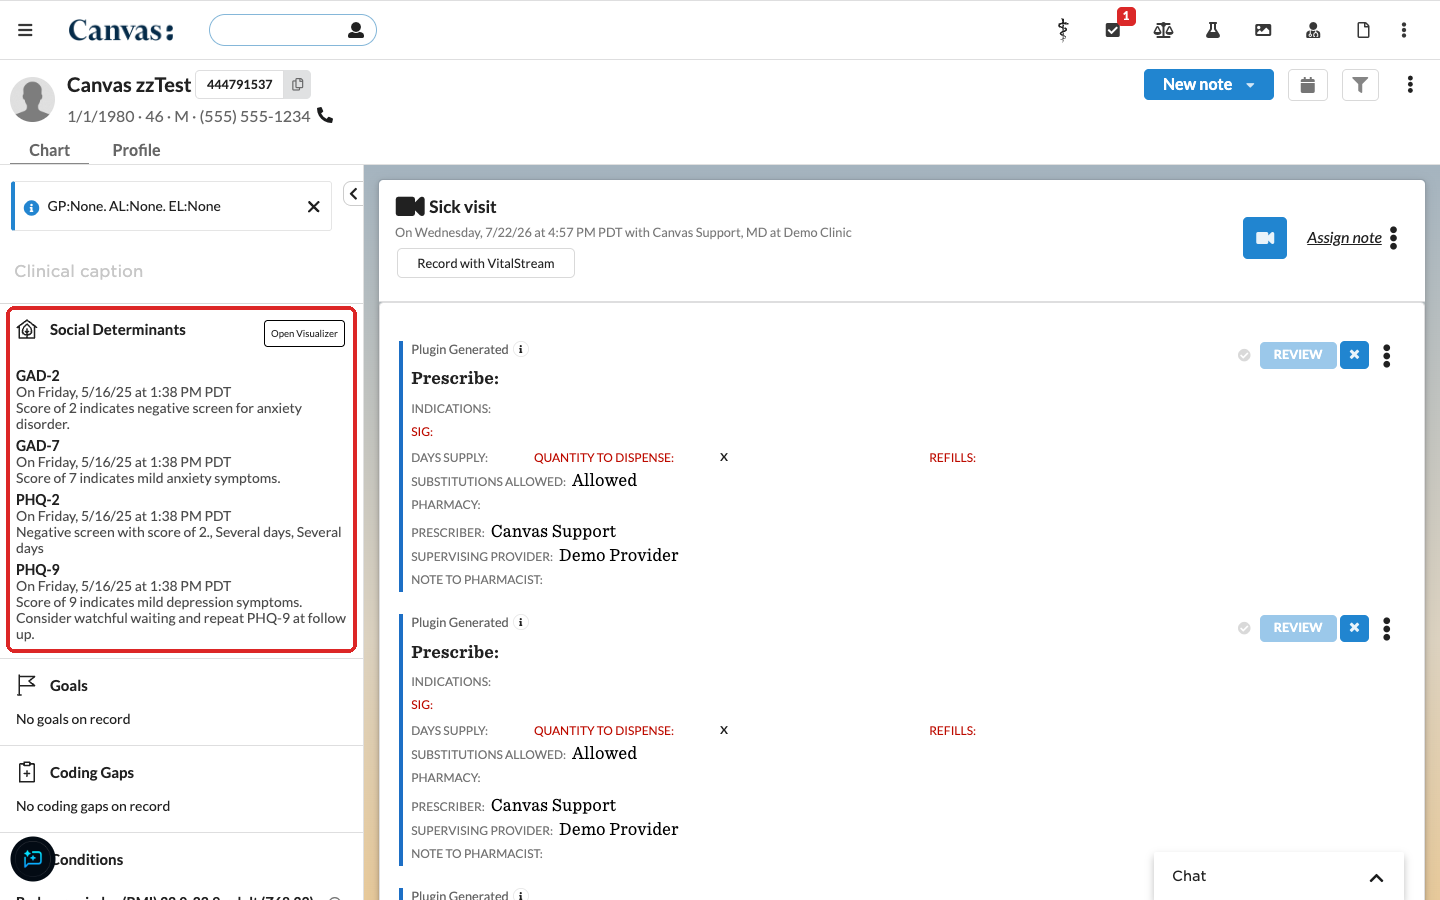
In the Social Determinants section of the patient summary, select Open Visualizer.
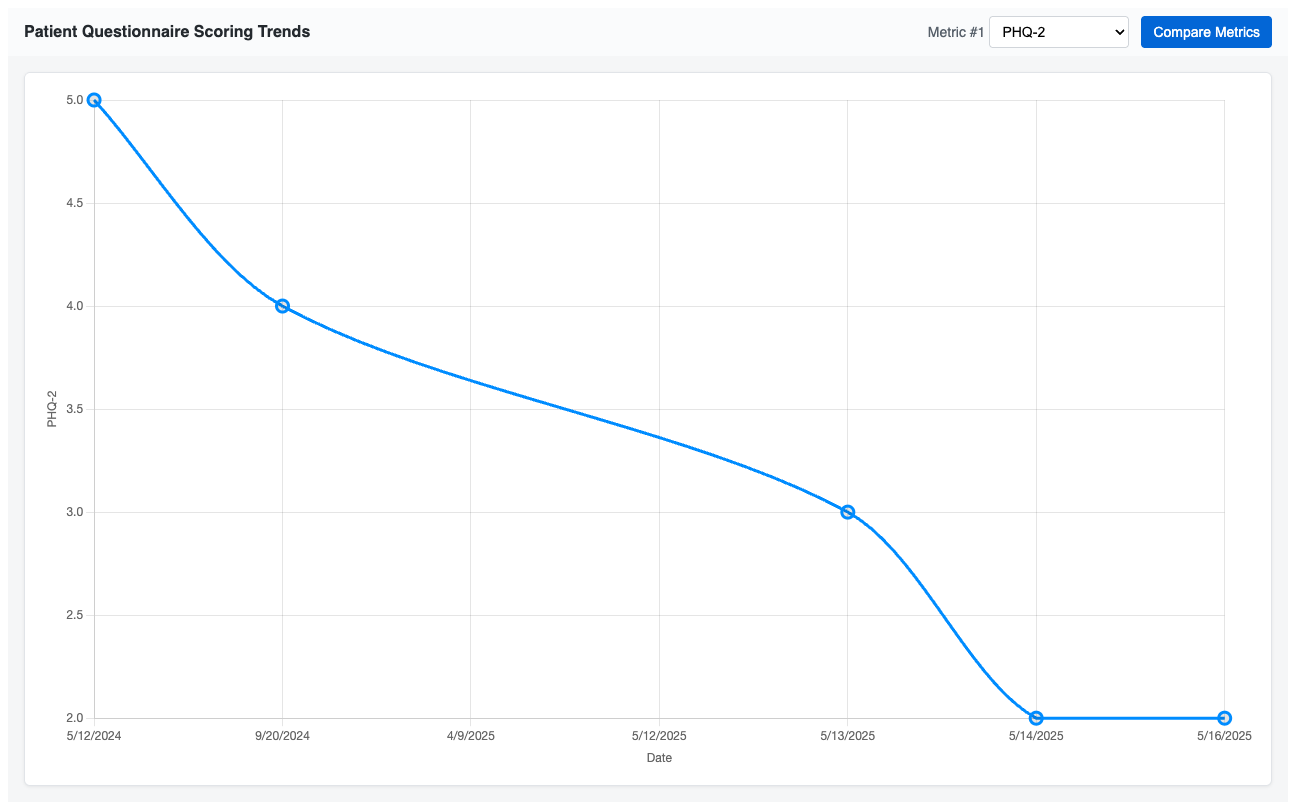
The Patient Questionnaire Scoring Trends window opens with a chart for one questionnaire.
Read the chart
Use the Metric #1 dropdown to choose which questionnaire to chart. The list includes every scored questionnaire on record for the patient.
Scores run up the left side and dates run along the bottom, oldest on the left.
Points are evenly spaced in date order, so the distance between two points does not reflect the time between them. Read the dates on the bottom axis.
When a questionnaire was not completed on a date shown on the axis, the line passes through that date without a point.
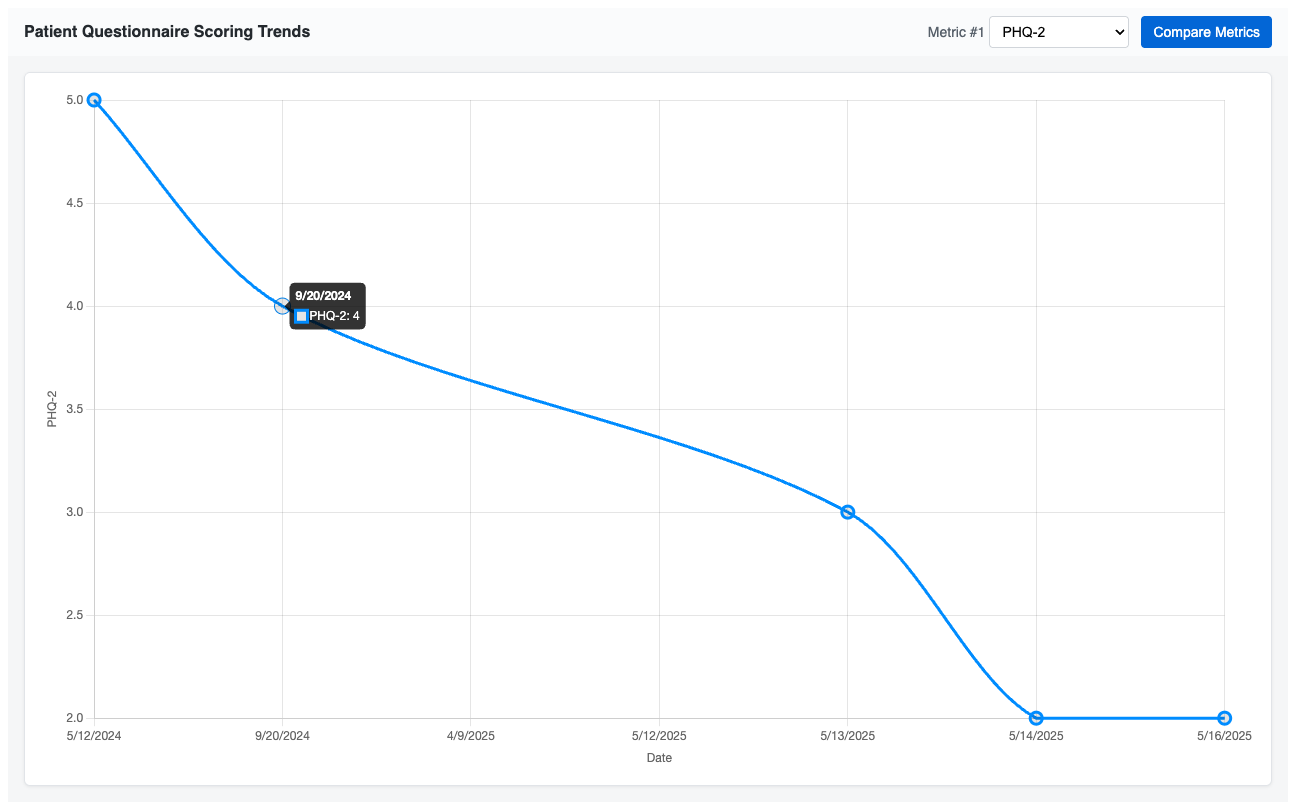
Hover over a point to see its date and score.
Compare two questionnaires
Select Compare Metrics.
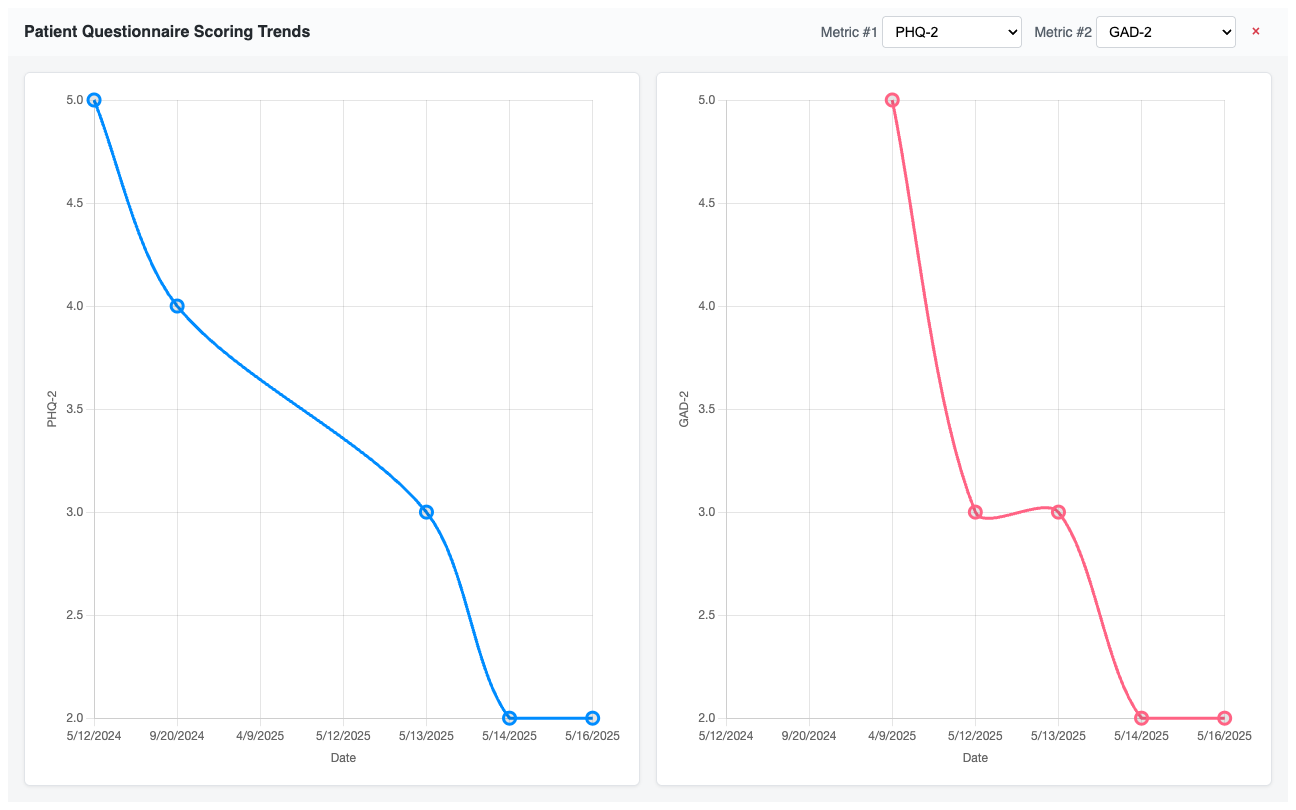
Choose a second questionnaire in the Metric #2 dropdown. The two charts appear side by side.
To go back to a single chart, select × (Remove Chart) next to Metric #2.
How dates are chosen
Each result is placed on the date the questionnaire was answered. When that date is not recorded, the plugin uses the date of service of the note the questionnaire was completed in, and otherwise the date the result was saved. Dates are calculated in US Eastern time, so a result recorded late in the evening in another time zone can appear on the following day.
Install the Plugin
Find the plugin to install at https://github.com/Medical-Software-Foundation/canvas/tree/main/extensions/visualizations/scoring_visualizer