Platform Analytics
Last updated: November 5, 2026
Platform Analytics helps you identify plugin issues, review available fixes, and monitor plugin performance across your Canvas instances.
Go to Platform Analytics in the sidebar and select Issues or Performance.
Access and Permissions
Analytics Feature | Required role |
|---|---|
View Issues | Any organization role |
Apply fixes | Studio user or Studio admin |
View Performance | Read-only, Plugin developer, Deploy manager, or Organization admin |
Issues
Canvas monitors plugins for performance, security, reliability, and deprecation issues.
When Canvas detects a problem in a Customer-managed plugin, Studio prepares a fix. The issue appears in Platform Analytics once the fix is ready for review.
Canvas-managed plugins are handled separately. Canvas fixes those issues and releases updates automatically, so they don't appear in your Issues list.
Review an Issue
Open Issues: Go to Platform Analytics → Issues. Issues are sorted by severity, then by most recently seen.
Filter the list: Use Severity, Kind, Fix, Last seen, Issue, or Plugin. Click Clear filters to reset.
Choose a view: Switch between Card view and Table view. Your browser remembers your preference.
Open an issue: Click Review & apply if you can apply the fix, or View to review it.
Review the problem: See when it was detected, affected instances, and the associated Studio project or plugin. What we observed summarizes the issue; See technical description provides more detail.
Review the fix: What the fix does explains the proposed change and who maintains the plugin.
To apply a fix, see Fixes from Canvas Platform.
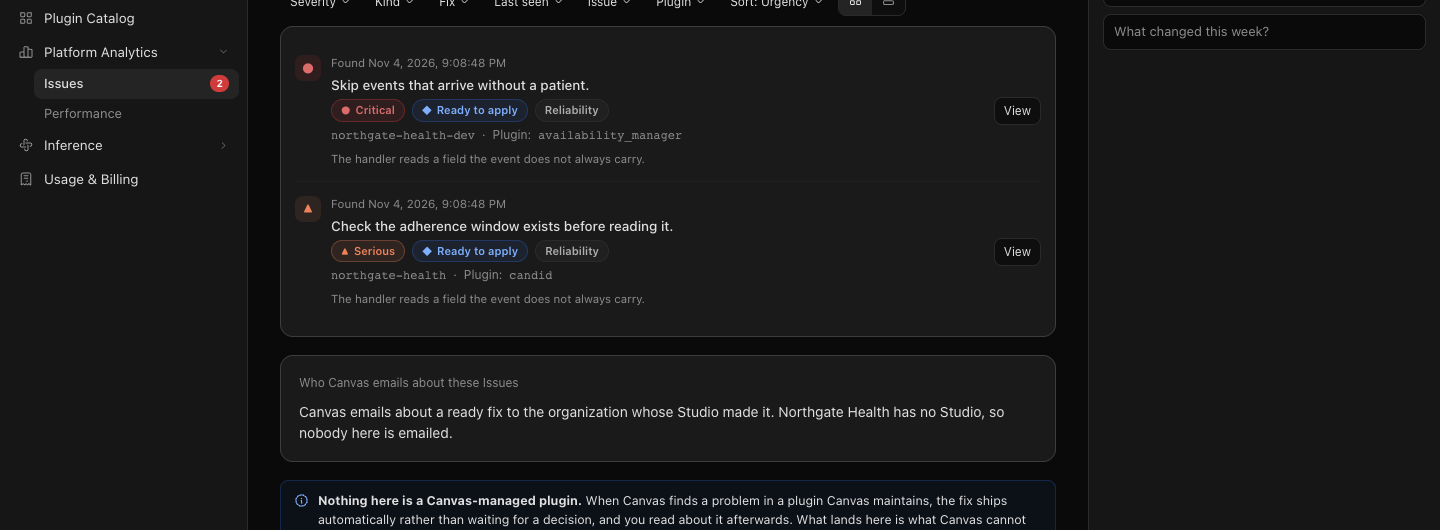
Issue Severity and Type
Issues are categorized by severity:
Severity | Meaning |
|---|---|
Critical | Highest priority |
Serious | High priority |
Warning | Lower priority |
Opportunity | Suggested improvement rather than a problem |
Each issue also has a Kind: Performance, Security, Reliability, Deprecation, Standardization, or Opportunity.
Track Fix Status
Status | Meaning | Next step |
|---|---|---|
Ready to apply | Studio has prepared and tested a fix. | Review and apply it. |
Confirming on [instance] | The fix is installed, and Canvas is verifying it's running. | No action needed. |
Testing on [instance] | The fix is running on your Studio test instance. | Test and publish from Studio. |
Released to [instance] or Released to 2 of 3 | The fix is published to release targets. The count shows how many are confirmed running it. | No action once all targets are running the fix. |
After applying a fix, the issue page displays Where the fix stands, showing progress from Fix ready through testing and release, including each release target.
If you use Studio, click Open the Studio project → to continue the release process.
Performance
Performance helps you understand how long plugin code takes to run on a specific instance, identify slow plugins, and track changes over time.
Canvas measures every plugin call and updates performance data daily. The latest day's data is available by the following day.
Monitor Plugin Performance
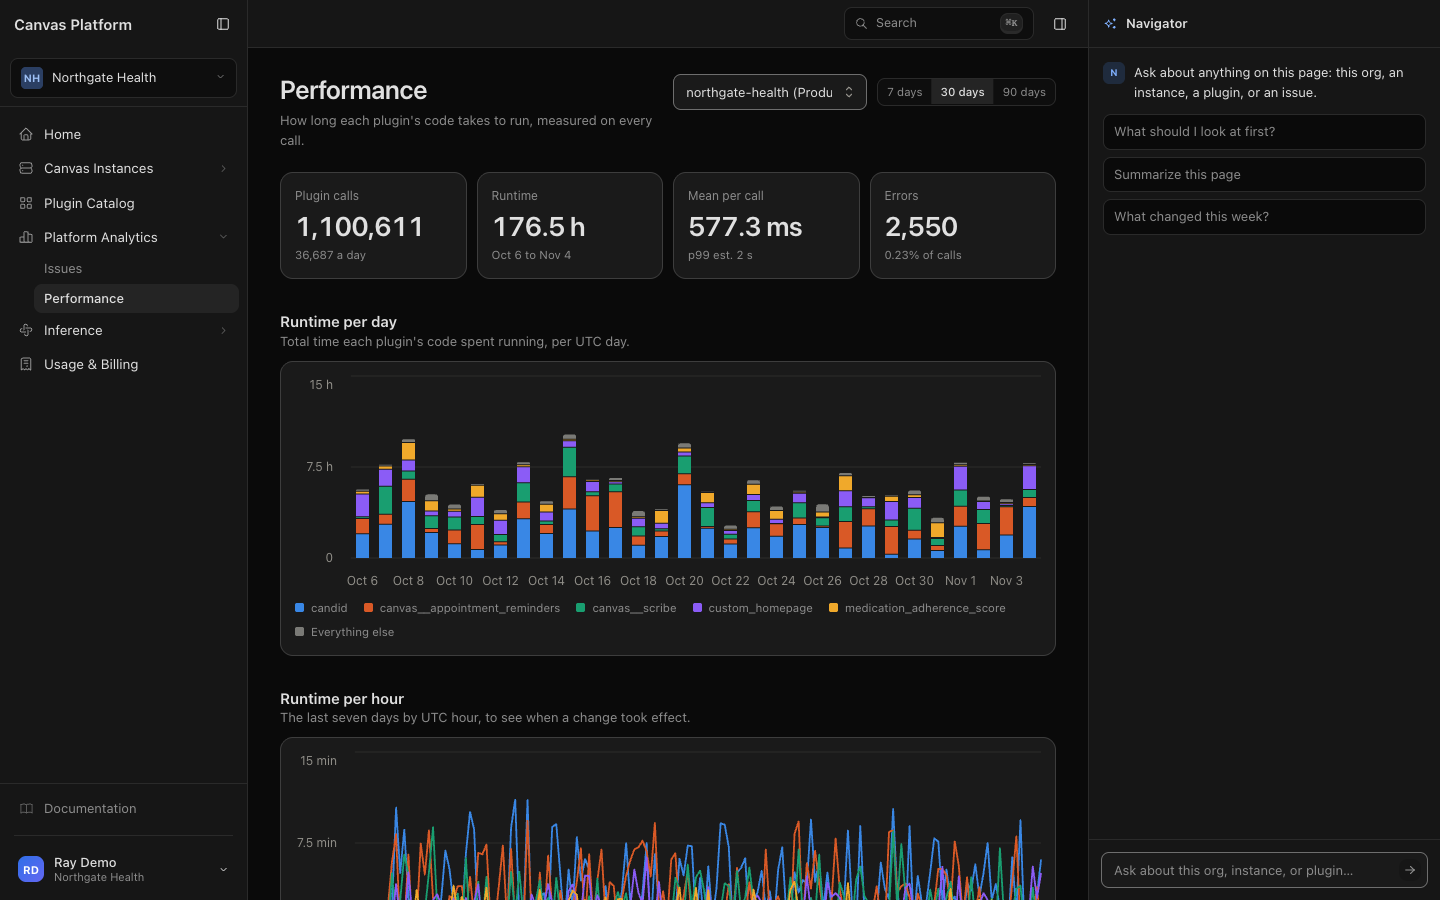
Open Performance: Go to Platform Analytics → Performance.
Select an instance: Your production instance is selected by default, if available.
Choose a time range: 7 days, 30 days (default), or 90 days.
Review summary metrics:
Plugin calls: Total executions.
Runtime: Total execution time.
Mean per call: Average execution time.
Errors: Failed calls.
Review trends:
Runtime per day: Daily runtime for your five busiest plugins, with the remainder grouped under Everything else.
Runtime per hour: Hourly activity over the last seven days to help identify when performance changed.
All dates and times use UTC.
Find slow plugins: In Every plugin, use Group by (Plugin, Handler, or Handler and event) and Sort by(Runtime, Mean, p99 est., Calls, or Slowest). Filter by plugin name using the Plugin column.
Export data: Select Download this table ↓ to export the current table, or Daily detail CSV ↓ or Hourly CSV ↓for detailed data across the selected range.
Understand Performance Metrics
Metric | Meaning |
|---|---|
Calls | Number of times the plugin code ran. |
Errors | Number of failed calls. |
Runtime | Total execution time. |
Mean | Average execution time per call. |
Median est., p95 est., p99 est. | Estimated typical and slower execution times. Estimates may run high for plugins called only a few times per minute. |
Slowest | Longest individual execution. |
Minutes over 5 s | Number of minutes containing at least one call longer than five seconds. |
Performance summary on Home
If you're a Deploy manager or Plugin developer, your Home page also shows a weekly performance summary. It identifies the slowest handler when its estimated p95 reaches 500 ms or more, or confirms that all handlers remained below that threshold. Click Dismiss to hide the summary.
Frequently Asked Questions
Why is my Issues list empty?
Canvas hasn't identified any customer-managed plugin issues with fixes ready for review. Canvas-managed plugin issues are handled separately. For problems you've identified yourself, contact your Canvas team.
Why can't I apply a fix?
The issue page explains why the action is unavailable. Applying fixes requires the Studio user or Studio admin role. Ask an Organization admin to update your access.
Why can't I see Performance?
Performance requires the Read-only, Plugin developer, Deploy manager, or Organization admin role. Ask an Organization admin to update your access.
Why does Performance show "No timings yet"?
Canvas updates performance data once per day. For new instances, the first day's data appears by the following day. Days that haven't been processed won't show a bar on the chart.